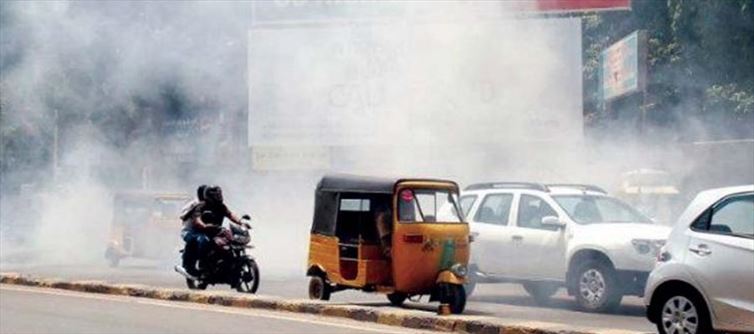
Between november 20, 2020 and november 20, 2021, the pollution levels of several indian cities were analysed, and the results were compared with both the WHO-recommended air quality standards and the National Ambient air Quality Standards (NAAQS). According to the research, Hyderabad's yearly average PM2.5 concentration was slightly higher than the NAAQS and WHO annual guidelines, which are 40 and 5 points, respectively, for the city. The city's annual average for PM 10 was 75 to 80 points. This pollutant should not be more than 60 points or 15 points, according to the NAAQS and WHO yearly standards, respectively.
Sanath nagar has the highest annual pollution levels among the six pollution monitoring locations, followed by Zoo Park and Bolarum in terms of both PM 2.5 and PM 10 levels. The air Quality Index can be used to quantify how much air pollution contributes to disease and higher mortality rates (AQI).


 click and follow Indiaherald WhatsApp channel