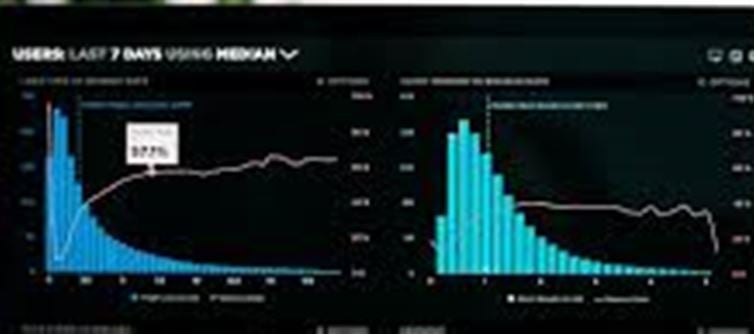
🔍 Overview
Google Data Studio is a powerful, free tool that transforms your raw data into clear, interactive, and actionable dashboards. Whether you’re tracking website analytics, sales figures, or any other data, Data Studio’s dynamic reports help teams quickly understand performance and make informed decisions.
One of its biggest advantages is automation—reports update in real-time, saving valuable time and effort while ensuring you always work with the latest data.
✨ Benefits of Dynamic Reports in google Data Studio
· Interactive Dashboards: Filter, drill down, and explore data on the fly.
· Real-Time Updates: Automatically syncs with data sources like google Sheets, google Analytics, and more.
· Collaborative: Easily share reports with your team or stakeholders.
· Customizable: Tailor reports with charts, tables, maps, and more to suit your needs.
🛠️ How to Create Dynamic Reports in google Data Studio
Step 1: Connect Your Data Sources
Start by linking your data from platforms such as google Sheets, BigQuery, google Analytics, or other supported connectors.
Step 2: Choose a Report Template or Start From Scratch
Google Data Studio offers ready-to-use templates for various industries and metrics, or you can design a custom layout.
Step 3: Add Visual Components
Drag and drop charts, tables, scorecards, and geo maps to visualize your data effectively. Customize colors, fonts, and styles to match your brand.
Step 4: Make It Interactive
Add filters, date range controls, and clickable elements so users can explore data based on their needs.
Step 5: Automate and Schedule Updates
Ensure your data source connections are live, so reports update automatically without manual intervention.
Step 6: Share and Collaborate
Share your report with colleagues or clients with view or edit permissions. Embed reports in websites or presentations for wider reach.
💡 Tips for Creating Effective Dynamic Reports
· Focus on key metrics that matter to your audience.
· Use consistent color schemes and formatting to make reports easy to read.
· Leverage filters and controls to empower users to find insights themselves.
· Keep your dashboards clean and uncluttered for better clarity.
🚀 Why Use google Data Studio for Your Reporting?
By using google Data Studio’s dynamic reporting capabilities, you not only save time on manual report creation but also boost your team’s ability to make quick, data-driven decisions. The intuitive interface makes it accessible to both beginners and seasoned analysts.
Disclaimer:
The views and opinions expressed in this article are those of the author and do not necessarily reflect the official policy or position of any agency, organization, employer, or company. All information provided is for general informational purposes only. While every effort has been made to ensure accuracy, we make no representations or warranties of any kind, express or implied, about the completeness, reliability, or suitability of the information contained herein. Readers are advised to verify facts and seek professional advice where necessary. Any reliance placed on such information is strictly at the reader’s own risk.


 click and follow Indiaherald WhatsApp channel